 Tweet
Tweet
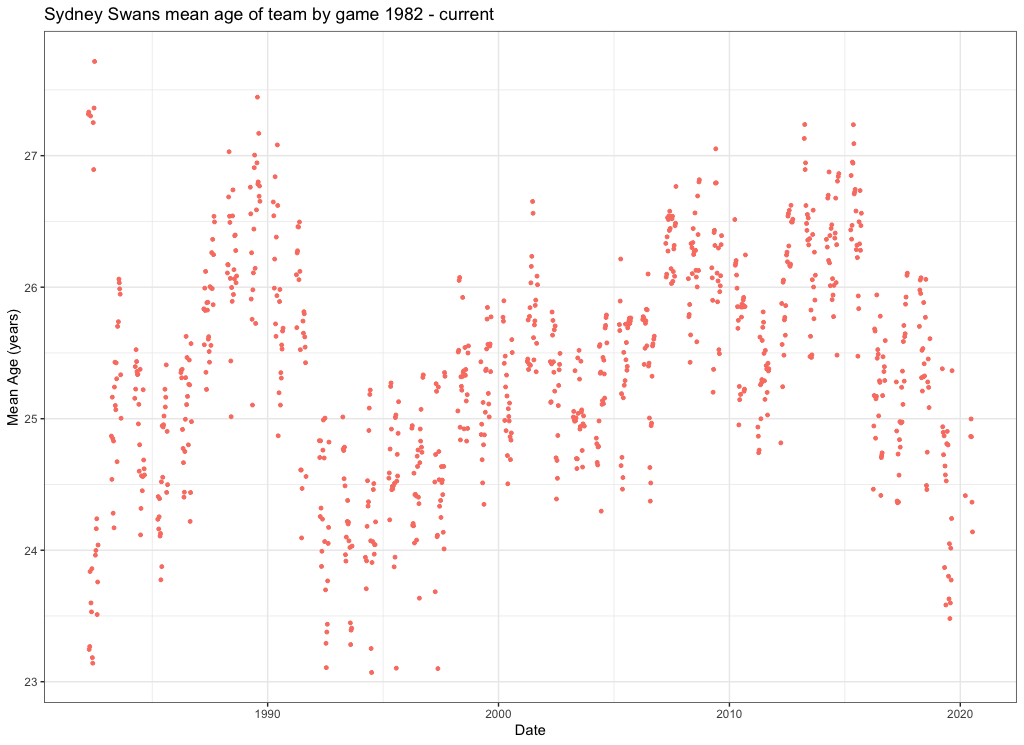
No, I can see why that chart took a while to make. Which makes me slightly hesitant to ask, but since I know that you love your stats: do you think that you could do a version where each of our grand finals are green dots? Just to see if they fall into some sort goldilocks zone. Assuming that there's a goldilocks zone. And assuming that each data point is a game.
And it's interesting from that chart, just how much experience we lost in 90/91, but the average age in our grand final year of 96, wasn't that much more than 92.
And it's interesting from that chart, just how much experience we lost in 90/91, but the average age in our grand final year of 96, wasn't that much more than 92.


Comment